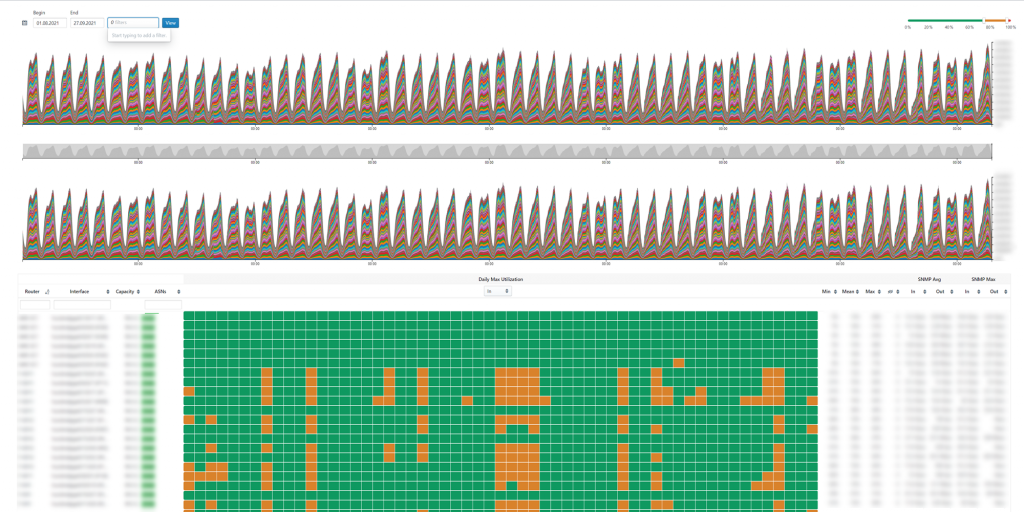
Network traffic is growing every day. We’ve known this for years, however the Internet events revolving around COVID-19 lock-downs showed us how dramatically it can grow over a short period of time. That is why BENOCS created the External Links Heatmap for Capacity Planning.
If you were following the news in spring 2020, you might remember Netflix announcing a reduction in stream quality for 30 days to ease the strain of video traffic on ISPs. So why did this happen? Well, the new (at the time) lock-down regulations turned the world as we knew it upside down with the Internet bearing the load. The once face-to-face contact activities such as work, socializing, education and entertainment, went virtual, which led to an unprecedented strain on the network. How?, you may wonder. For one thing, image content, specifically video, is very heavy, which creates a lot of traffic. Additionally, more users went online at the same time, clogging the Internet pipes and straining any through traffic . As a popular video streaming company, you, too would probably conclude that reducing network traffic was better than cutting off customers.
So, what does this anecdote have to do with BENOCS’ capacity planning? Well, as you can imagine, operators were overwhelmed by those surges in Internet traffic. Additionally, the tools they used to monitor the traffic, specifically external links, were too slow and complex to solve the issues fast enough. How could they know the very basics of their network’s performance? Who was filling their pipes? Where could they logically add more capacity?
What we mean by external links
As someone living in the era of the Internet, you are probably most familiar with the term “link” as an abbreviation for “hyperlink” or website address. As someone who is working in network operations, architecture, engineering or IT, you probably think of the connection or “link” between routers. When we talk about external links, we mean the links between routers sitting at the edge of the Internet backbone. These are the links that exchange traffic between different networks in the internet, e.g. a CDN and an ISP.
Although operators always maintained a close eye on these links, the pandemic proved that their methods needed an upgrade. What they needed was a tool that gave them an immediate overview of their links’ traffic behavior in as few clicks as possible to see potential overload of interconnects in real-time. That is what inspired BENOCS to create the External Links Heatmap.
The External Link Heatmap
The BENOCS External Links Heatmap consists of two main graphs: a time series and a daily peak utilization table. Additionally, both elements contain customizable filters, such as date-range and a utilization-threshold slider. These features allow users to determine which links are over-utilized and for how long. They also define at what percent of utilization a link is considered highly utilized. On top of that, users can filter for specific routers, interfaces or AS numbers as well as whether the traffic is going in or out of the network.
The pandemic might slow down, the Internet traffic growth does not. Therefore, its time to consider exploring new options for network traffic analytics before the next quick surge in traffic.
Are you interested? Check out our product webpage for more information or get in touch directly with us today!
