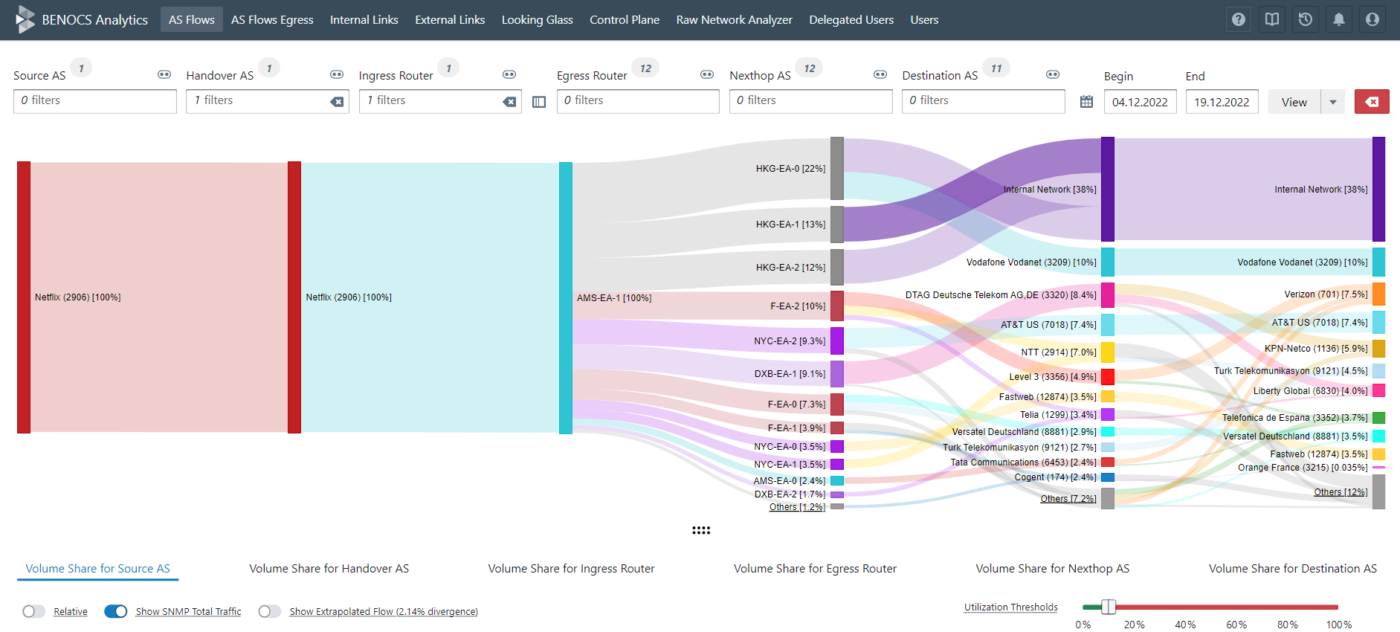
Flow analytics tools, such as our own, are great for seeing how traffic flows enters and leaves your network in order to determine its behavior. However, when it comes to answering questions such as “who filled my pipe (aka who is consuming valuable backbone capacity)?”, or “do I need to raise transit prices?”, you often find yourself limited by the information these tools can provide.
If you are using any near real-time flow analytics today, you are probably impressed with how much it can show you about your network’s traffic in just a Sankey diagram. BENOCS’ Sankey, for example, can show you the dimensions of your traffic spanning all the way from source to destination. It also reveals how traffic has entered and exited the network backbone. However, despite all of these dimensions, being able to see how traffic travels through your network is often missing. That is why BENOCS now offers Flows on Links: displaying information between network routers that don’t usually export flow (e.g. LSR’s). Using information collected from the Interior Gateway Protocol (IGP), the Flows on Links features gives users the ability to see who is sending traffic through each individual link in the network backbone.
What is IGP and why do we use it?
Although widely ignored in analytics tools, Interior Gateway Protocol (IGP) offers significant benefits when integrated in the data pool. That’s why IGP has been an integral element of BENOCS Analytics from the very start.
IGP provides the full topology overview of a network and – if augmented to flow-information – can describe the entire path a packet is using to traverse through that network. This fills the blind spot between the ingressing and egressing network borders. It also allows the application of flow-based information even on links which are not exporting any flow. Sounds magic? That’s probably because it is.
How you can benefit from IGP
With the information provided from IGP, we are able to project individual flows on Links at any point in the Internet backbone. Then, by correlating IGP with BGP, we are able to display the flow of traffic into, through and out of the network. These flows include all known dimensions, like Source, Handover, Ingress, Egress, Nexthop and Destination, which can be displayed and filtered for each network segment you want to examine. As a user, this means you receive an image of your network traffic that shows you right away which companies are “filling your pipes”.
If you were to imagine multiple streams all leading to the same river, BENOCS Flows on Links adds a different color to each stream. Therefore, when you look at the river, you can see exactly which drops of water came from which stream (as long as you imagine the colors won’t blend together).
How Can I Access Flows on Links?
BENOCS’ Flows on Links is designed for anyone looking to know who is loading their links, who is (ab-)using their network backbone, who should be charged more for transit and how to cope with network upgrades.
Sound like something you need? Get in touch with us today.
